Logs
Description
Logs are used to store the history of the integration. Users can view detailed logs for troubleshooting, auditing, and monitoring the integration performance.
Logs List
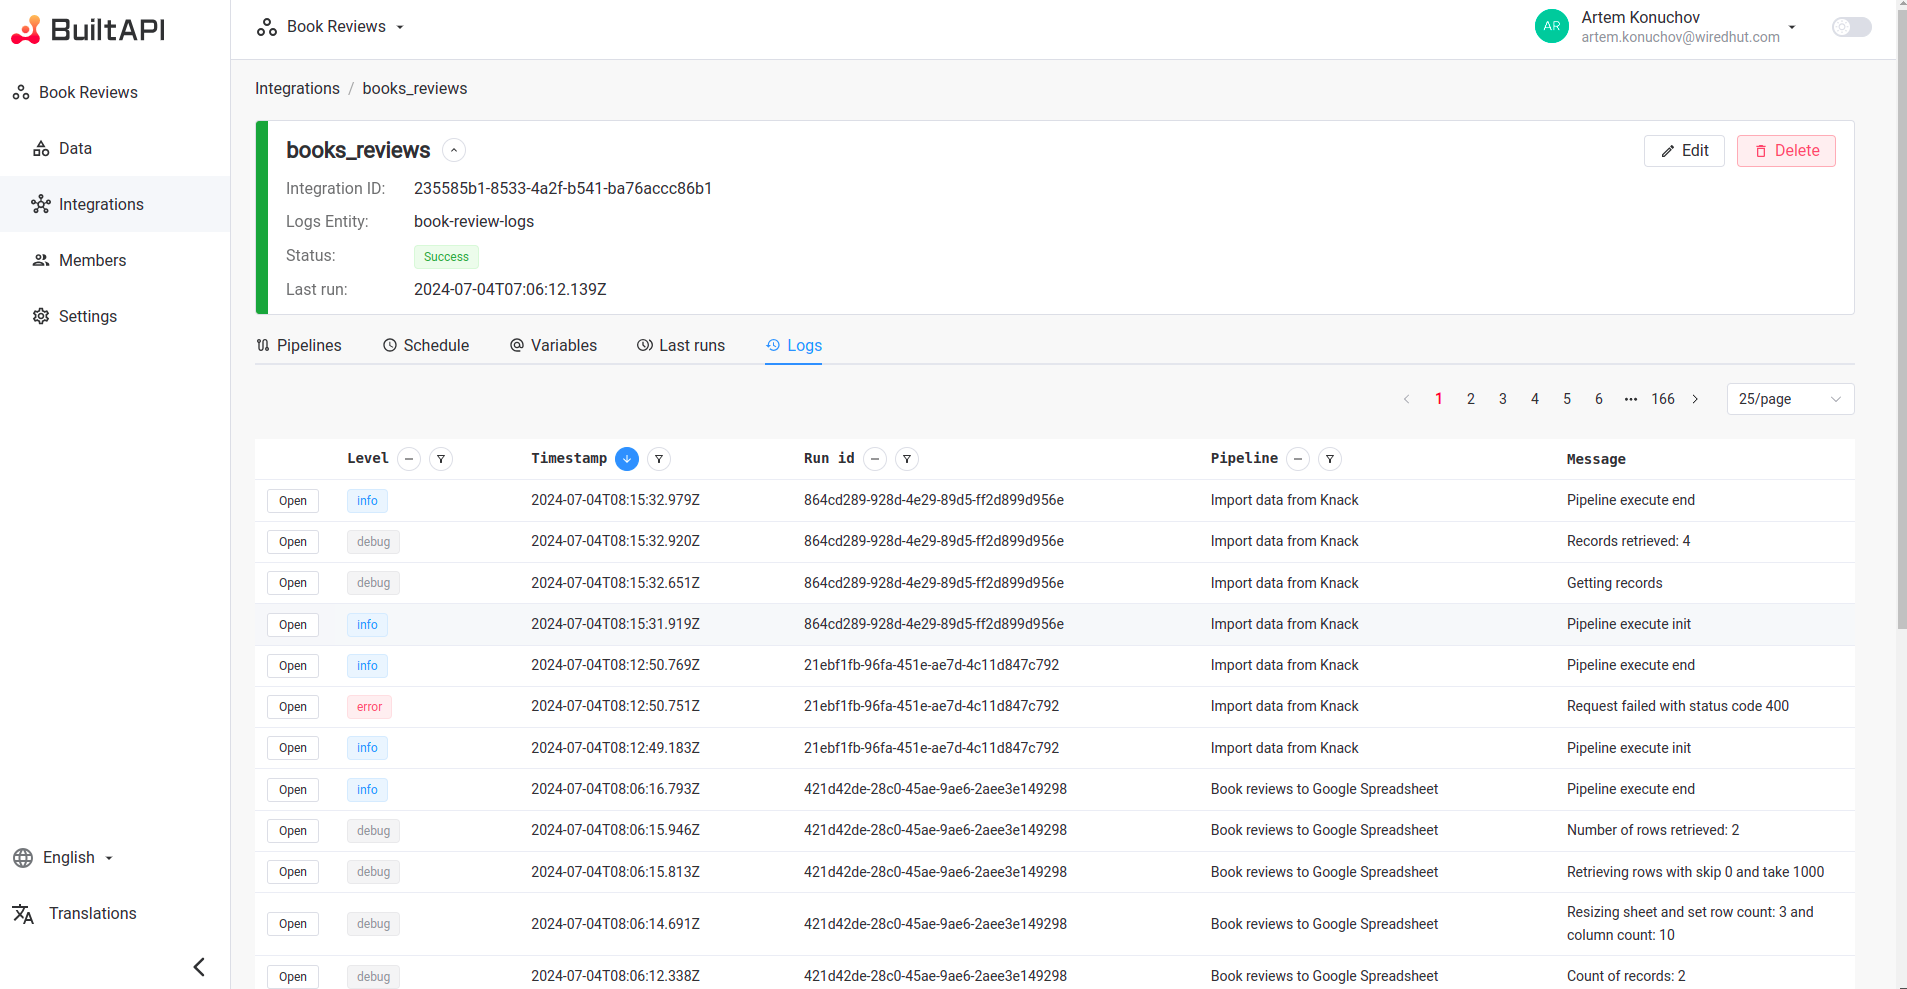
Logs are displayed on the "Logs" tab of the Integration Detail Page. Users can quickly see the log message, level, and timestamp for each log.

Columns
- Level: The severity of the log message. Available options are:
- info: General information about the integration.
- debug: Detailed information for debugging purposes.
- warning: Potential issues that may affect the integration.
- error: Critical issues that require immediate attention.
- Timestamp: The time when the log was created.
- Run id: Unique identifier for the run.
- Pipeline: The name of the pipeline that generated the log.
- Message: The content of the log message.
Actions
- Open: View the detailed log object
Filters
Users can filter logs by:
- Level: user can select one or many levels: info, debug, warning, error
- Timestamp: user can select the time range
- Run id: user can enter the run id
- Pipeline: user can select pipeline
Sorts
Users can sort logs by:
- Level
- Timestamp
- Run id
- Pipeline
Open Logs from Pipeline status
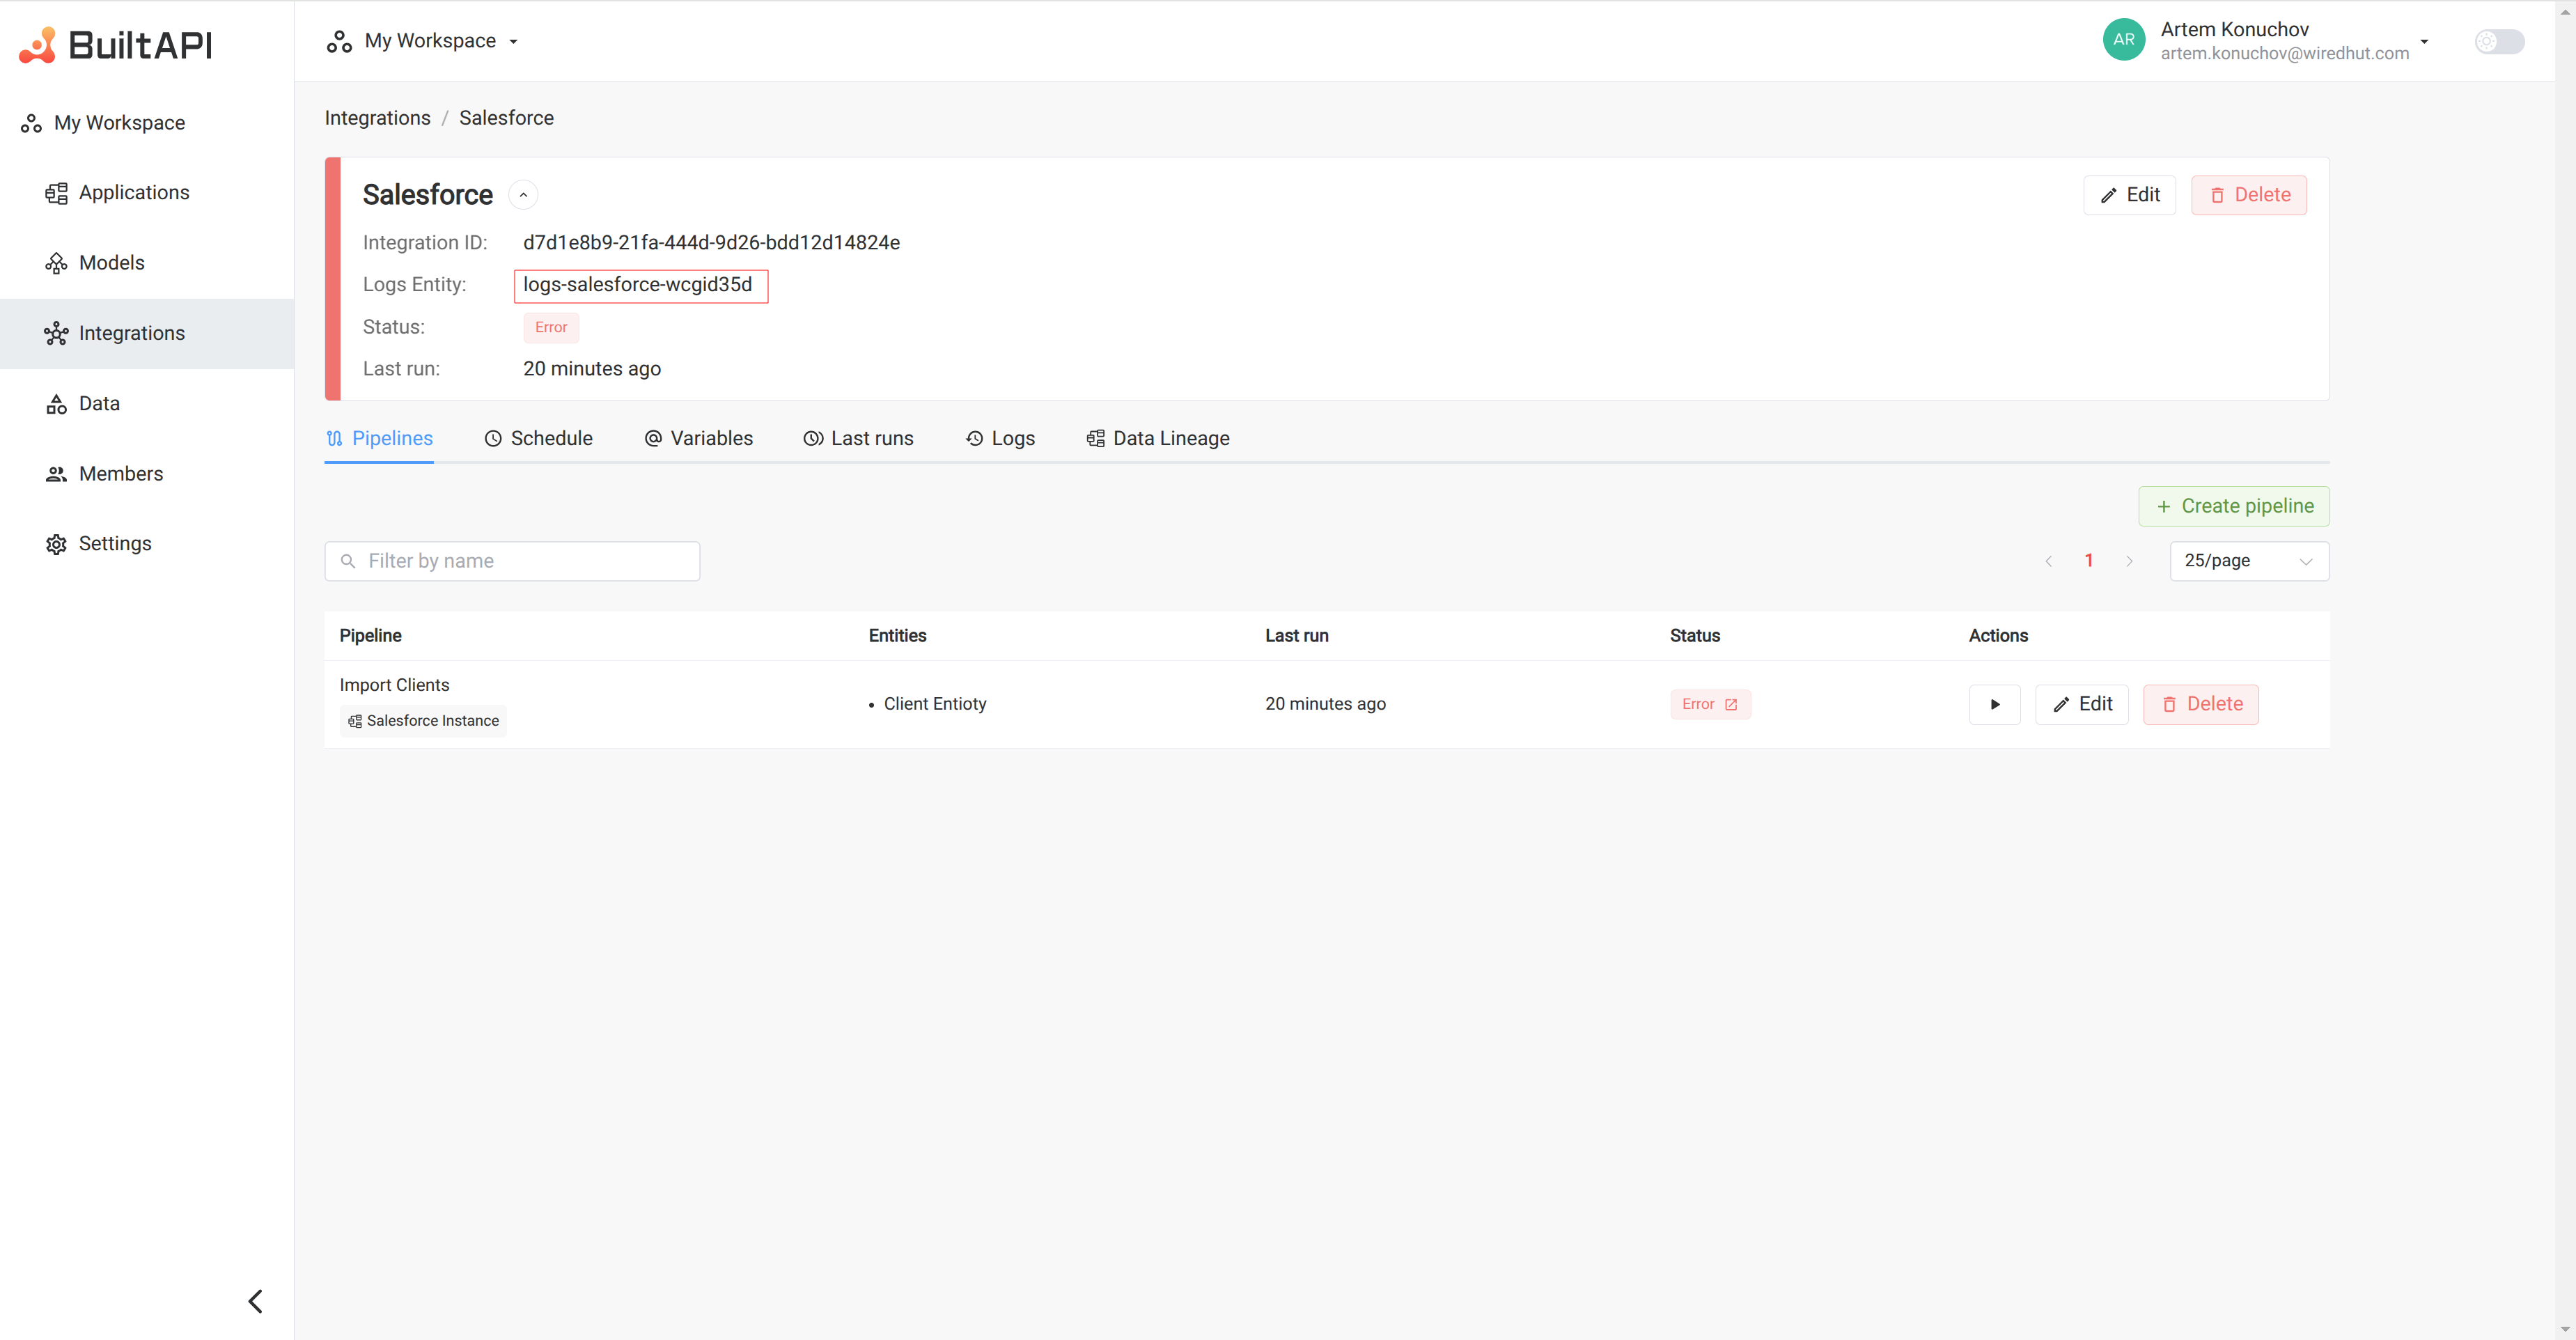
Users can open logs from the pipelines tab clicking on pipeline status button. This will open the last run logs for selected pipeline. If the pipeline status is "error" the logs will be opened with Level filter set to "error".
Logs Entity
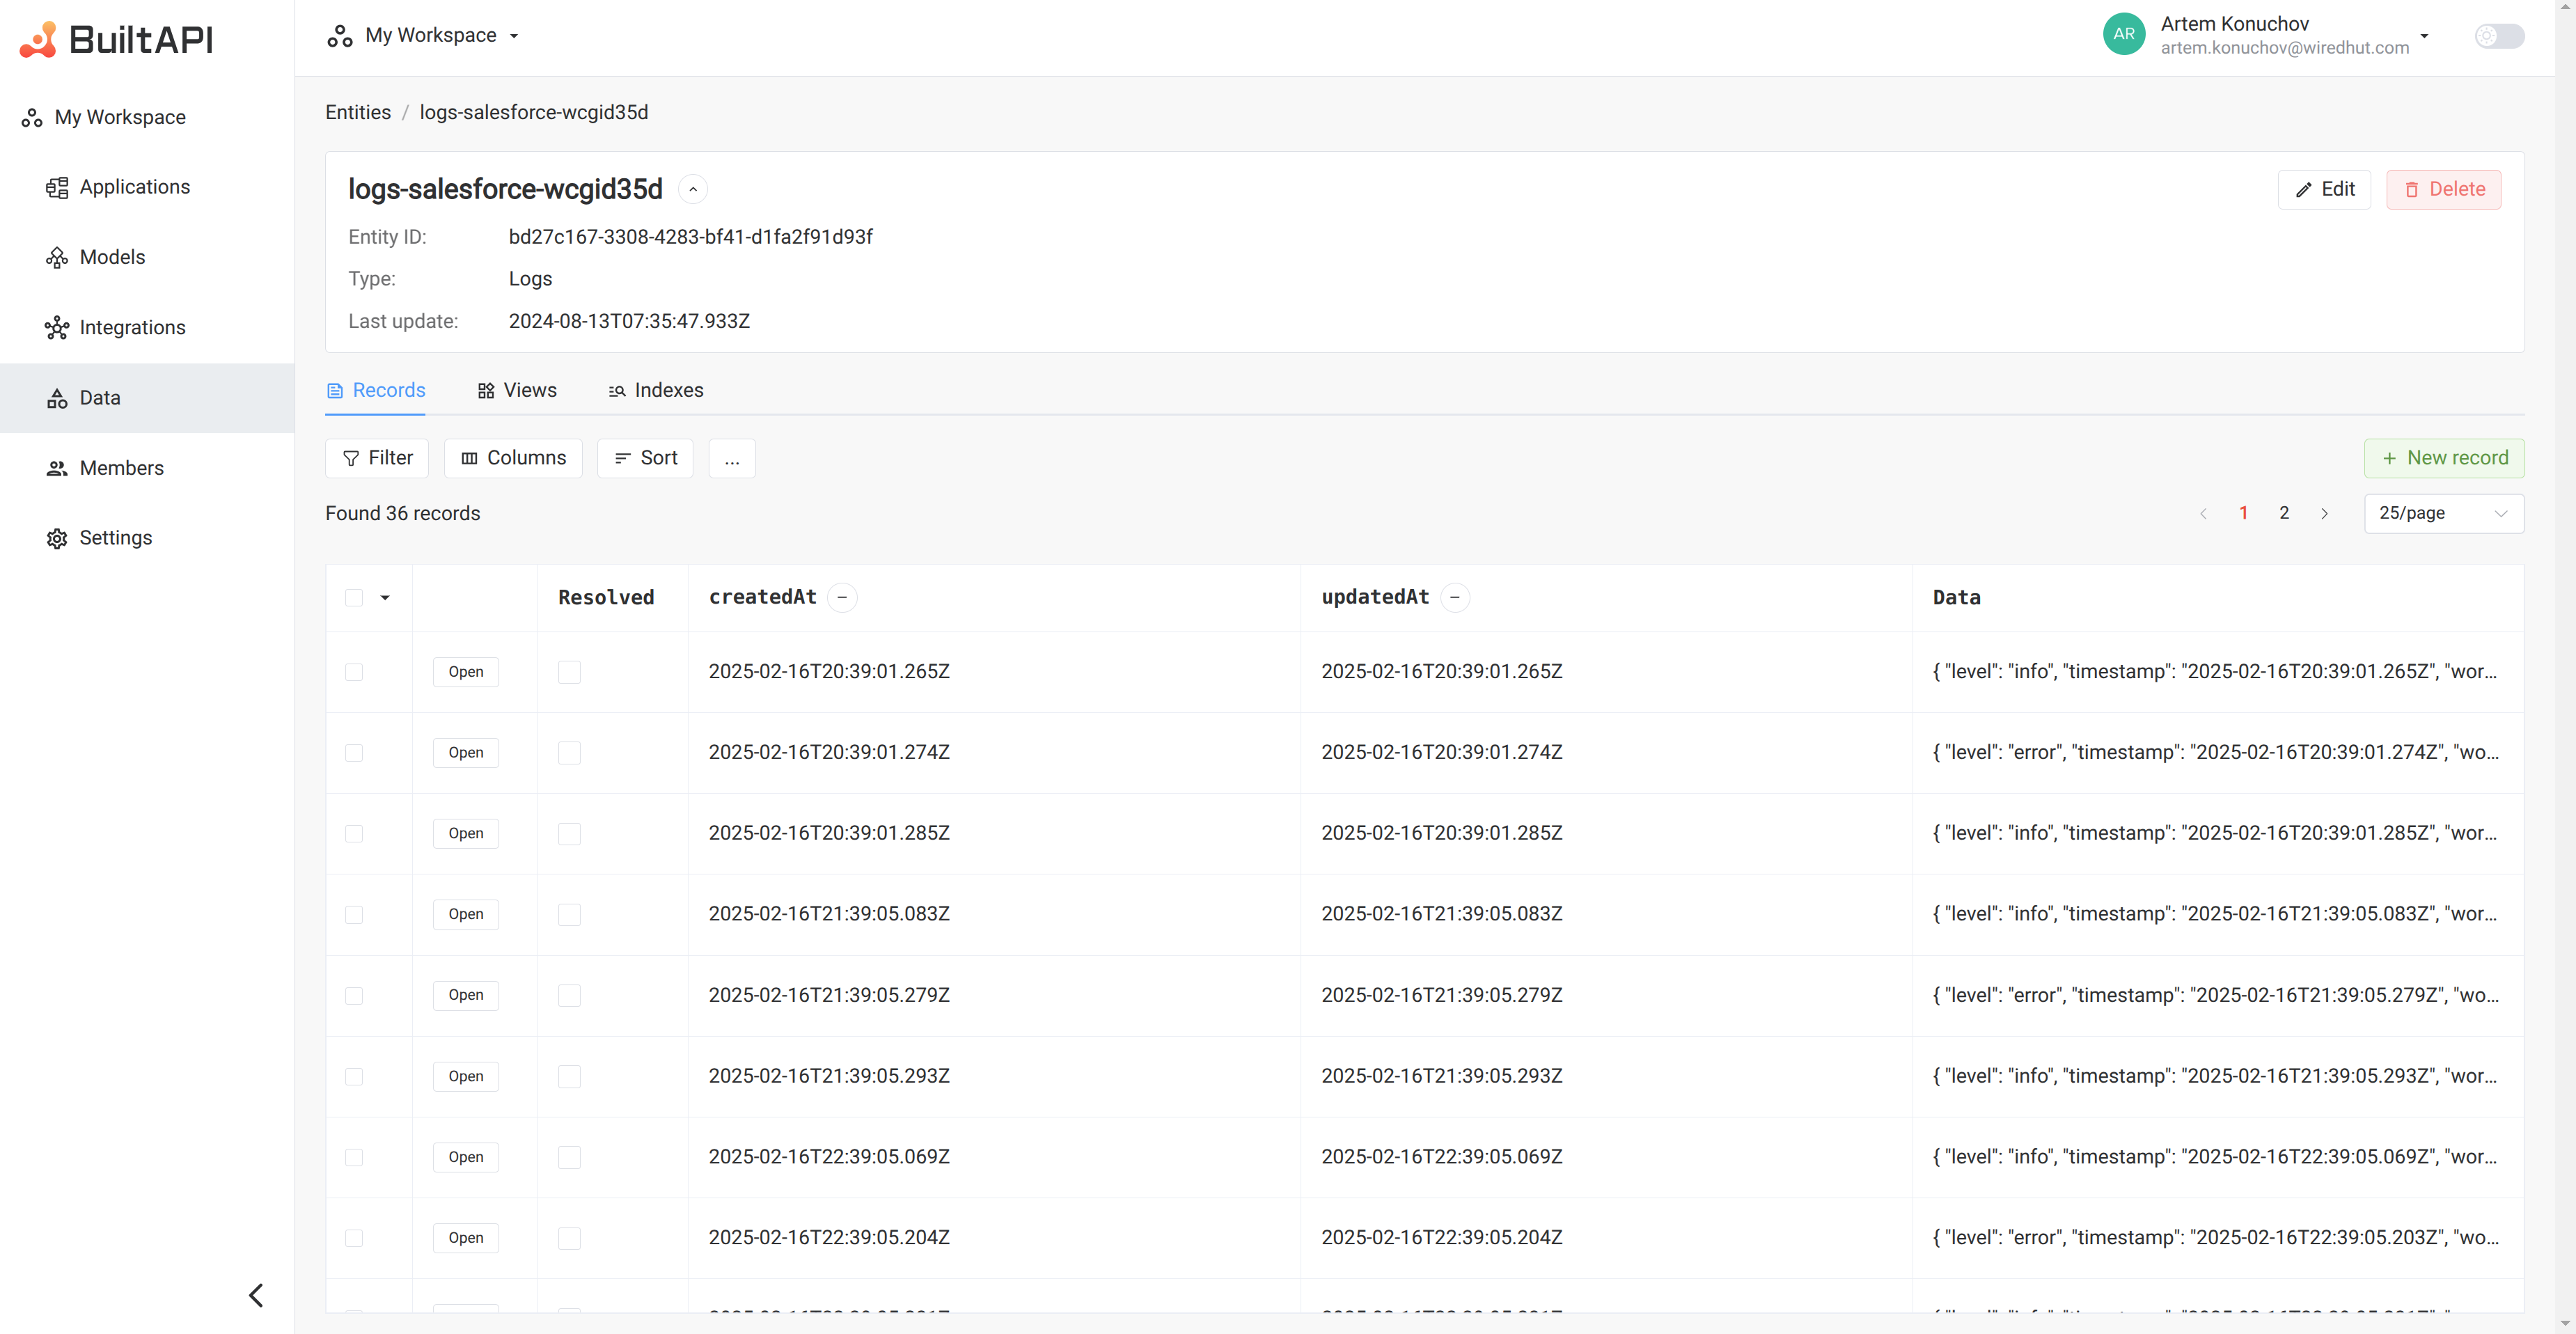
Logs for each integration are stored in the "logs" entity. Users can access the logs entity to view all logs for the integration.

Logs entity records table contains additional column "Resolved" which indicates if the log was resolved by the user.
